Interpreting Performance Test Results
Once a performance tests and run, it’s disco analysis is performed and test results persisted. Results or downloadable and persisted in the Cloud Native Performance format.
Graphical View
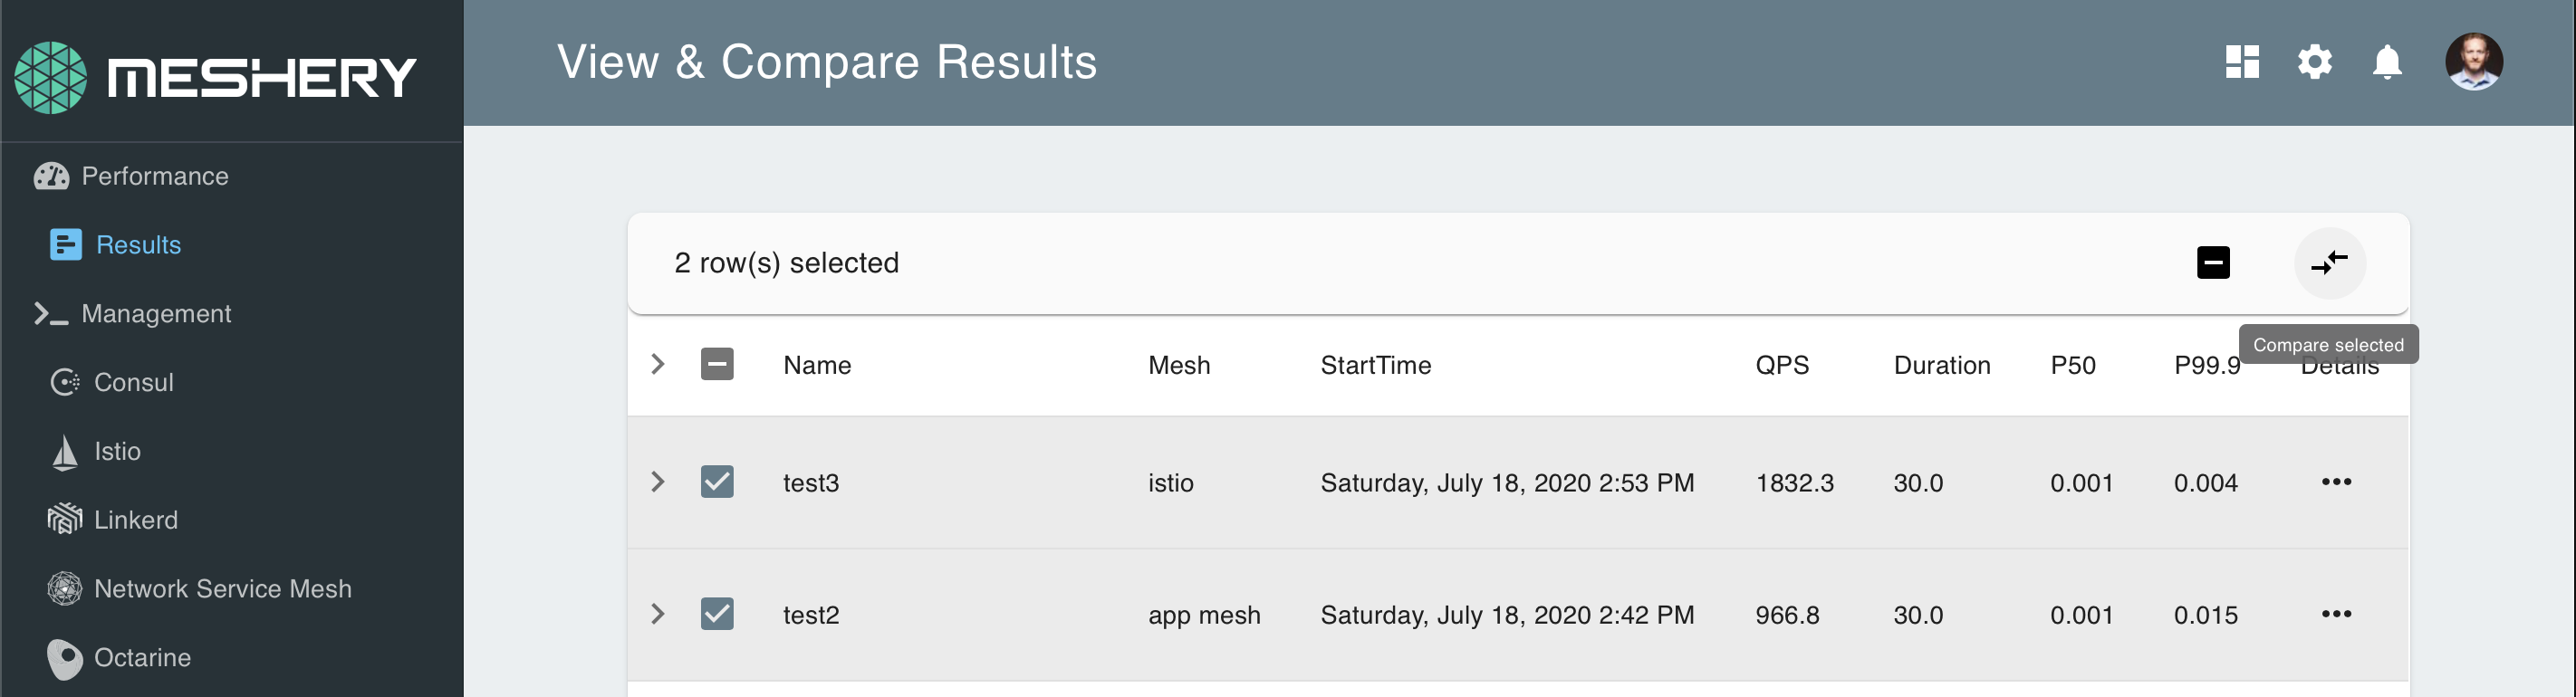
Tests
For the best experience, you should compare between two or more tests of similar configuration. Tests that are configured with a high degree of variance (e.g., one test ran for a duration of 5 minutes, while another test ran for a duration of 1 hour) will produce comparisons that are more difficult to extrapolate insights from.
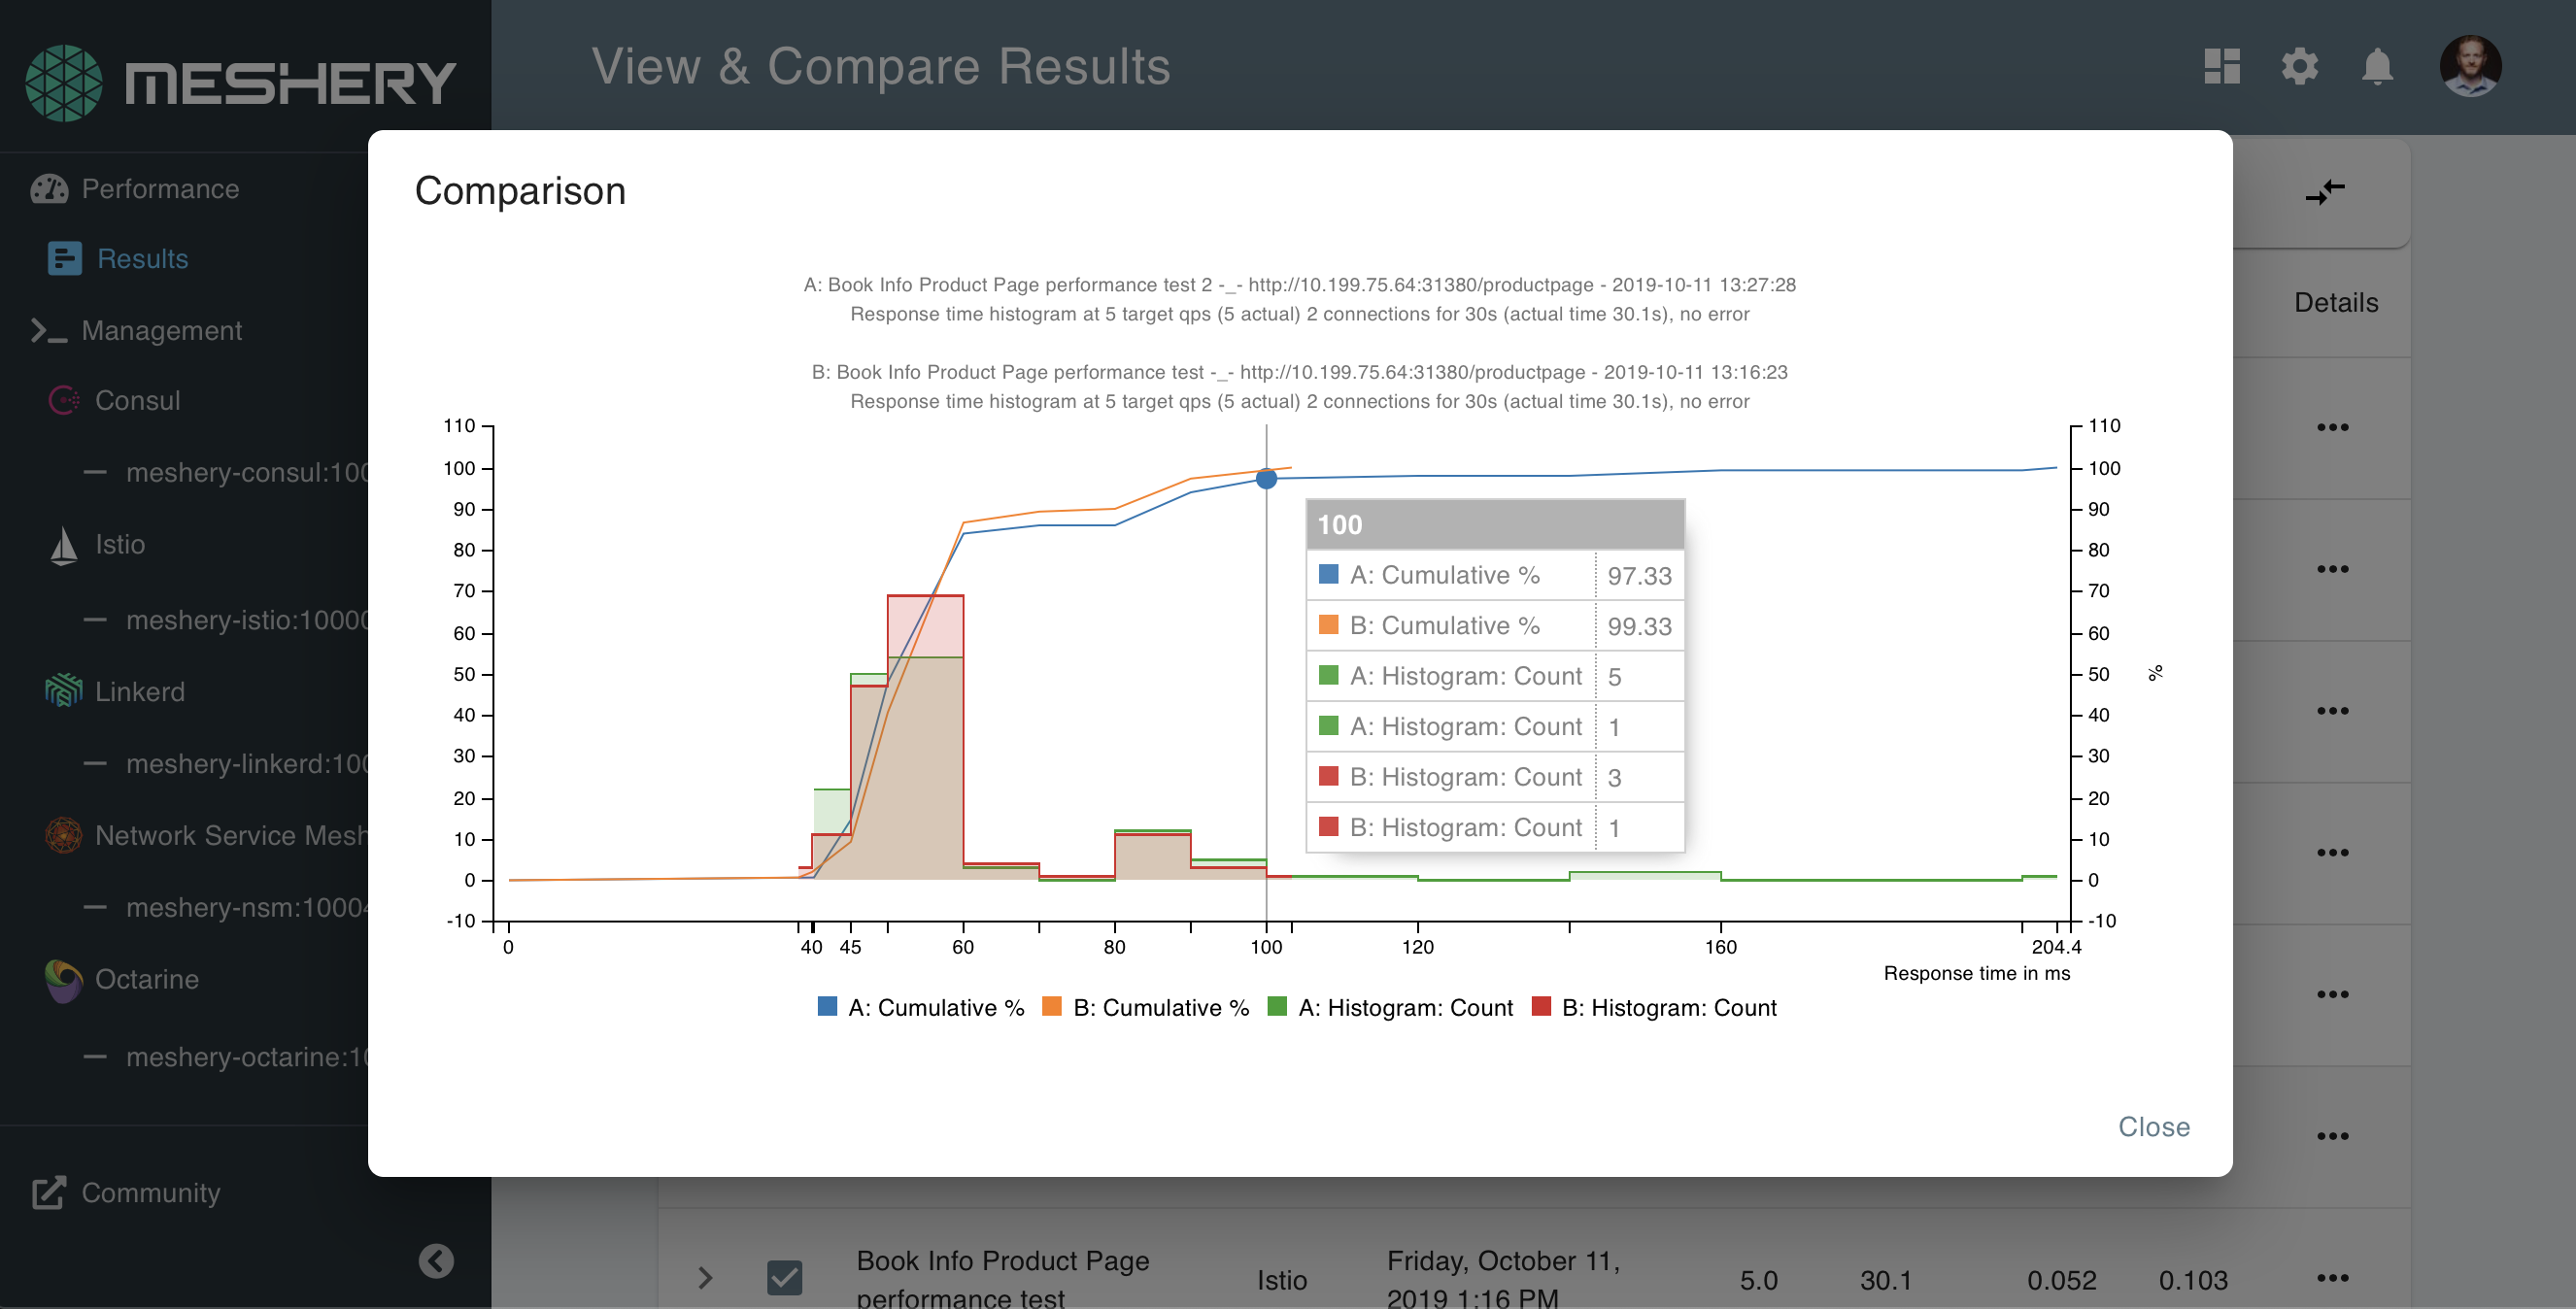
Latency and throughput are the two most significantly examined signals.
Meshery will use different algorithms to calculate results depending upon which load generator was used to run the test.